
Econosights: Australian housing – impacts from the fixed rate mortgage “cliff” and risks to housing construction
Introduction
In this Econosights we look at some of the current issues in the housing market, including the the expiration of fixed rate mortgages and the outook for residential construction.
Expiration of fixed rate mortgages
Housing lending surged in 2021 for owner-occupiers as demand for new homes got a boost from low interest rates, government fiscal transfers to households and the HomeBuilder subsidy, with lending up by 26% over the year to Dec-2021. Investor lending also surged in 2021/22 (after bottoming in 2020) as uncertainty around the pandemic eased and rapidly rising prices encouraged investors back in to the market.

Source: ABS, AMP
Fixed mortgage rates declined in 2021 (the 3-year fixed rate bottomed at 2.1% in mid-2021) because of increased competition between lenders, lower costs of borrowing thanks to the RBA’s Term Funding Facility and the RBA’s 0.1% three-year bond yield target. This led to a big lift in mortgage holders fixing their loans. Usually, fixed lending is 10-15% of total outstanding lending in Australia but in 2020/21, this lifted to over 40% (see chart below).

Source: ABS, AMP
In Australia, the term for fixed home loans is usually for a period of 1-5 years (quite different to the US where you can fix for 30 years and refinance inbetween if interest rates fall which is a good deal for mortgage holders). CBA analysis of their lending book suggests that the largest share of these loans expire in the second half of 2023 which means that households will roll onto a variable mortgage rate that could be 2-3 times their current fixed rate. The households impacted make up around ~30% of the total housing loan stock according to bank data which is a significant downside risk for consumer spending. We see consumer spending growth declining to just over 1% per annum in late 2023, well down from 4% over the year to March 2022. Some potential offsets to these higher costs of debt include the accumulated savings of households (worth around $250bn) which can be utilised, high mortgage prepayments (RBA research suggests ¾ of variable mortgages are more than 3 months ahead on repayments) which reduces the risk of missed payments/bad loans in the short-term and rising wages growth.
The residential construction outlook
The fall in net migration in 2020/21 from Australia’s closed borders (net migration only turned positive again in the December quarter of last year for the first time since March 2020) was negative for fundamental housing demand. However, this was offset by a fall in mortgage rates, cashed up households, a fall in the size of households due to the pandemic and the HomeBuilder subsidy which lifted demand for new housing. Residential construction added up to 0.7 percentage points to annual GDP growth in mid-2021, its highest annual contribution since 2004.
Net migration is starting to rise again which is positive for residential construction. But, rising interest rates, higher construction costs and the end of the HomeBuilder subsidy (which brought demand forward) are headwinds for new housing demand. Building approvals have plunged for houses, down by 29% over the year to May while apartment approvals are holding up better (down by 4.2% over the year to May).
Despite the recent weakness in building approvals, residential vacancy rates fell to around 1% in June, which is around their lowest point since the SQM data started in 2009 (see the chart below), after reaching a cycle high of 2.5% during the pandemic. The fall in the vacancy rate is a sign that more new housing construction may be required.

The fall in vacancy rates has been broad-based across the states and territories but are lowest outside of Sydney and Melbourne. Vacancy rates lifted in Sydney and Melbourne the most during the pandemic (reaching 4% in Sydney and 4.5% in Melbourne) as these two cities tend to be the destinations for new immigrants and students. Large interstate outflows from NSW and Vic (see chart below) into Qld and WA also put upward pressure on vacancy rates in Sydney and Melbourne. Solid labour markets and the return of migration should see falls in Sydney and Melbourne vacancy rates.

Source: ABS, AMP
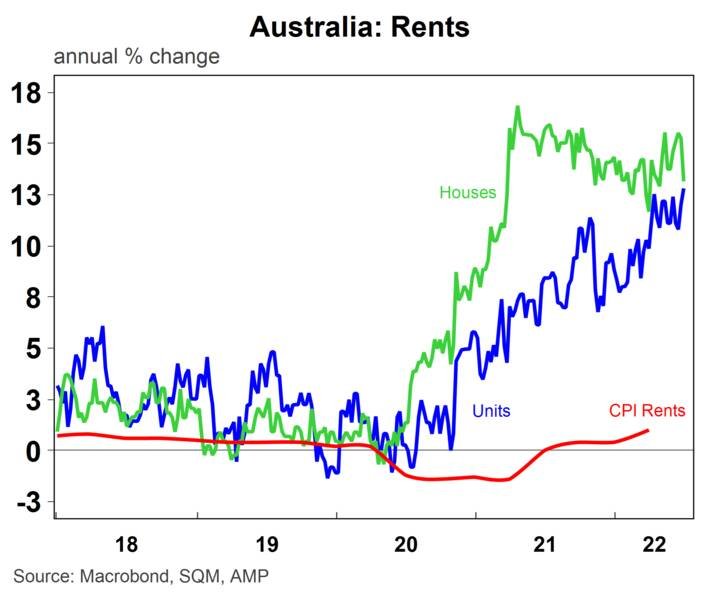
The low vacancy rate is lifting rents. Asking rents (rents for properties newly advertised) are running at 12% year on year for houses and units and are much higher than the rents in the quarterly consumer price index data (which include all rents) which are still tracking at only 1% year on year to March (but further rises are likely from here).
Despite the lift in interest rates, rising rents could encourage investors into the market, especially as home prices decline (we expect a 15-20% peak-to-trough fall in national dwelling prices into 2023) which will lift rental yields.
Building approvals and completions of detached houses has some further downside from here as demand normalises post HomeBuilder but apartment approvals should do better as net migration returns. Rising interest rates will have a negative impact on housing demand but falling residential vacancy rates suggests that housing construction needs to rise further. We expect building approvals to be around 180K in 2022 and 160K in 2023, down from 228K in 2021.
This means residential construction will be a small drag on Australian GDP growth over the next 12-18 months (see the chart below) but we are not expecting a collapse in construction as interest rates rise.

Source: ABS, AMP
Diana Mousina
Economist – Investment Strategy & Dynamic Markets
(AMP Capital)